
A little while ago, I wrote an article called “What’s An Insight? (And Who Decides?)” which drilled down on the differences between truly insightful findings and everything else. In a nutshell, insight boils down to something that wasn’t already known that is relevant to the problem at hand. It provides new perspective and equips the audience with the confidence to take meaningful action.
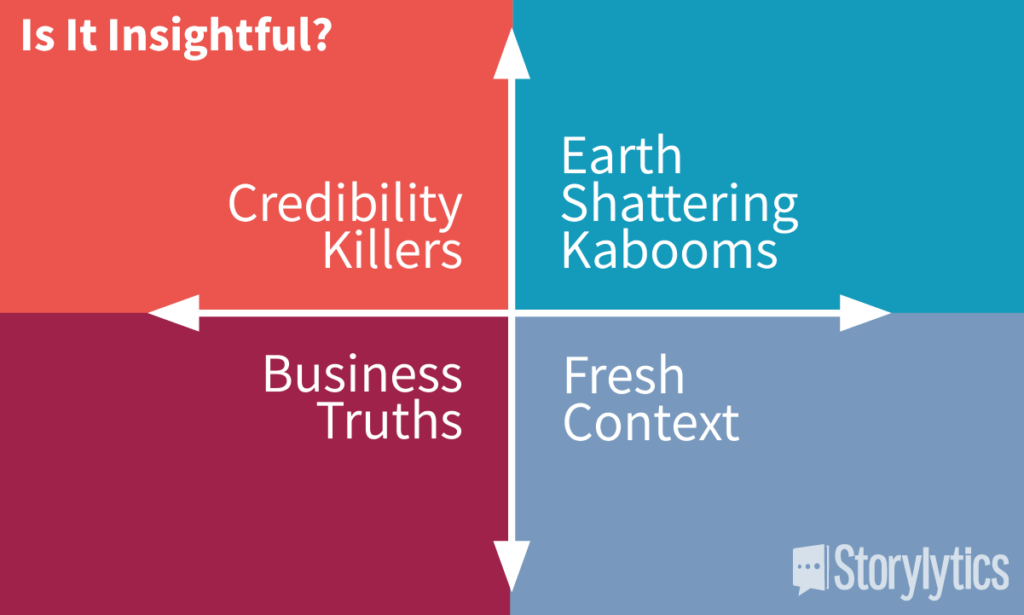
On the “Is It Insightful?” matrix (see right), anything that falls in the top right obviously has the potential to be insightful, but I know what you’re thinking�what about the other quadrants?
Examining what you’ve pulled from your data and applying the descriptions of each quadrant will help you to determine where your work lands, and, if you aren’t where you want to be, how you can shift your position to a more productive place.
Let’s give you some focus by considering each one of the quadrants in turn.
Credibility Killers
Okay, I know you’re worried, so let’s start here. Yes, this quadrant has a terrifying name, but fear not�while it’s the harshest experience, it’s also the easiest to fix.
If you’re hearing feedback along the lines of “This is a bit of a data dump,” or “Where’s the insight,” or “That’s not quite what we were looking for,” it’s highly likely you’re in this space.
Effectively what’s happening is that there is a disconnect between the audience’s expectation and the presenter’s perception. There are lots of reasons why this may be happening, but there are three pretty common ones to consider:
- The “We worked really hard” conundrum: In this case, you may be a little too enamoured with your own information. You may not even know it, but chances are, you’ve fallen prey to the need to illustrate how big the study was or how much work you did.
- The “Just in case” tack: Because of a lack of confidence in or knowledge of what’s relevant to the audience, you present everything because it all seems important.
- The “It’s interesting to me” trap: What’s interesting to you might not be interesting or relevant to your audience. Just because you find it insightful doesn’t mean others will.
But, there is good news: Intellectual curiosity is what got you here. If you can complement that skill with deeper knowledge and solid storytelling, it’s a quick jump over to delivering the oh-so-satisfying Earth Shattering Kabooms we’re all after.
So what now?
It’s about knowledge and not skill. Remember, to connect with an audience is to know what makes them tick. Why do they consider the issue at hand to be a problem? What do they think about it? What are they wondering? Ask the hard questions and have the rich conversations. Then, take an honest look at your business acumen: Are there any gaps in your knowledge of the business that would help your interpretation of the data? (You may need someone else to help you make this assessment.) Adding context and good storytelling to your analytic curiosity will help transform your content into something compelling for your audience.
Business Truths
This quadrant is rich with potential, but it’s not delivering insights. Data here is merely foundational. It’s familiar. It has a place in providing context or confirming alignment, but you need to push further to uncover its value.
There is a risk in spending too much time here, in believing it’s important to the audience. Sure, the information shared might make people happy�because it doesn’t push anyone to a place of discomfort�but it’s not going to help anyone move beyond what’s already known.
So what now?
You’re clear on the core metrics of the business. Now it’s time to start stepping out and linking the data back to the business strategies and objectives. You know more than you think. Spread your wings a little�take a look at the desired results, and make an assessment. Is it what was expected? If not, why? If yes, how come? Ask questions and connect the dots between the data and desired performance; build the bridge for your audience. Be curious. Be confident.
Fresh Context
This title is deceptive. While it might seem harmless by name, this is actually a tricky place to be because it doesn’t look like a problem. But when insights are accidental�when we’re not consciously recognizing that the data truly has enlightened our audience�it means missed opportunities.
It’s also the quadrant that breaks my heart the most because it’s the last one people recognize as concerning. Superficially it looks fine, but there’s a major issue at play when it’s the audience who discovers the story, and not the presenter.
You’re here when you’ve presented information and the audience is so energized that they took over the meeting and decided next steps on their own. They might say, “That was so insightful!” and while you may be chuffed that your visualizations made the day, chances are, you learned more during the meeting about what to do with the data than you knew going in.
There’s nothing inherently wrong when the audience tells the story, rather than the presenter. After all, the audience gained new perspective based on the data. But this is “accidental insight.” It’s not planned, and not written in the material, which potentially leaves a lot of value at the door.
So what now?
First things first: Be self-aware and recognize you’re here. Acknowledge that there is a problem. Then go out of your way to explore the audience whys and link them back to business objectives and strategies. Assess your information in that context. Are there questions that aren’t being asked? Are questions being asked based on conjecture? Explore assumptions, correct as necessary, find the path and tell the story.
Earth-Shattering Kabooms
It’s an analyst’s nirvana, when an analysis finds opportunities that will have a material impact on a business’s success. And it should all be good, right? The answers are right there!
Not always. Sometimes, even when the insights seem obvious, it simply doesn’t land with the audience. You can be as brilliant as Einstein, but if you’re unable to communicate your value, it just fizzles.
Let’s be clear: Despite the title, an Earth-Shattering Kaboom is not always going to blow your mind. But it does need to generate an “aha” moment. You need at least a glimmer. It’s not always going to be totally disruptive, but it’s going to give you insight you didn’t already have.
Earth-Shattering Kabooms are often a series of small stories that eventually come together to make a big difference. They don’t have to make a lot of noise, but when they click, it’s awesome.
So what now?
Of course you should be here, but if something still feels off, you have a communication issue. Remember you’re talking to humans. Work on your storytelling. Your stories need to be more compelling, to inspire action and to drive change. Perhaps you missed a closely held belief that is holding someone back, or assumed knowledge they didn’t have. Meet your audience where they’re at, close the gap between problem and solution with relevant data, and offer solutions that align with strategies and fall into their sphere of influence.

If you?re wondering where you are on the matrix, or if you are trying to shift your position, let’s talk. Drop me an email at laura.warren@storylytics.ca.