

In the first few weeks after Netflix released the movie Don’t Look Up, my LinkedIn feed lit up with references to the film. Or more to the point, an early scene where the characters meet the United States president for the first time.
If you haven’t yet seen the movie, the segment that had everyone in my network talking started at 17:55 in the Oval Office. (No spoilers, I promise.) In just a few minutes of dialogue, we have a complete and hilariously accurate case study on the highs and lows of the data storytelling process. Stop reading right now and cue it up � you won’t regret it.
The Train Wreck
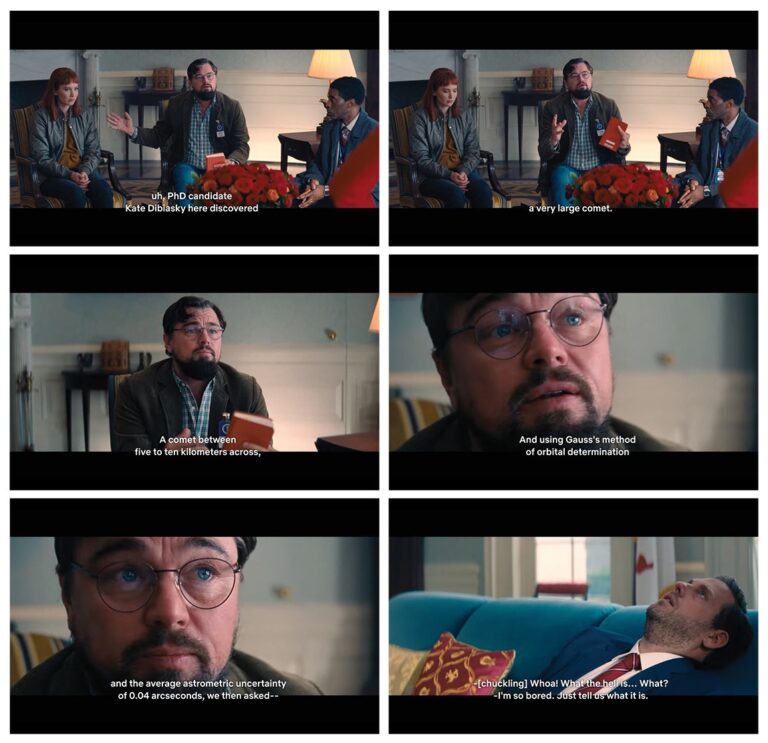
Let’s get the obvious out of the way first: The “presentation” that is central to this clip is a disaster (literally and figuratively). And it’s hilarious because it’s so relatable and true. Leonardo DiCaprio nails the scene as Dr. Randall Mindy. From the panicked expression upon hearing he only has 20 minutes to brief the president, to the excessive technical detail with which he starts, it’s a brilliant capture of the train wreck that can happen when presenting data to senior level people. It’s definitely a cautionary tale � don’t do this!
But let’s look beyond the obvious (because the other characters deliver an equally brilliant representation of audience needs and experience) and treat this as a case study of what could have helped break through instead.
Just Tell Me What It Means
Meryl Streep, playing the questionably competent president Janie Orlean, clearly articulates what any decision maker needs and expects from analysis. “I heard there’s an asteroid or a comet or something that you don’t like the looks of. Tell me about it and then tell me why you’re telling me about it.”
Wham! This was perfect. She knew the purpose of the meeting. (Win!) Then she stated exactly what she was expecting from the person she was addressing.
Take note � while your audiences may not actually say the same thing, it’s the unspoken contract you enter into whenever an action needs to be taken on data. Which, honestly, is pretty much all of the time. Stay focused on what your audience needs. Otherwise you’ll lose them, and then you won’t get to what you need.
Speaking of Losing Them?
When you watch the clip, you can see the exact moment the presentation goes sideways.
It’s when the president puts up her hands and Jonah Hill’s character, Jason Orlean, exhibits a full-body eye roll and exclaims, ‘So bored. Just tell us what it is. Seriously, stop.’
Most of us are too polite to react like this in a meeting. But quiet silence or a room of people checking their phones tells us the same thing.
Want to know an even better but more worrisome indicator that you’ve lost your audience? One minute after the end of the clip I shared above, the room jumps to their own conclusions and rapidly reaches their own, very poorly informed action plan that includes ‘sit tight and assess.’ I’ve witnessed more than one ‘sit tight and assess’ conclusion myself when the data failed to make the necessary impact.
It’s a powerful reminder: Stay focused on the outcome and choose the relevant information that particular audience needs to hear in order to engage in the conversation. Otherwise you risk losing them and your credibility along the way.
Solid Attempts to Get Back On Track
In this clip, there are two stand-out moments that beautifully represent what this audience � a non-technical audience with limited background � really needed to hear. Kate Dibiasky, played by Jennifer Lawrence, cuts through Leo’s muddled explanation to get to the point: “There’s a comet headed directly towards earth. And according to NASA’s computers, that object is going to hit the Pacific Ocean at 62 miles due west off the coast of Chile.” She’s essentially saying, “We’re the experts, here’s what we’ve found.” It expressed the data clearly in a way that would make sense to the audience. But it didn’t go far enough. It didn’t speak to the outcome, and there’s a risk when this happens. The audience clearly didn’t understand why it was a worry.
We needed another character to really bring that home. Dr. Teddy Oglethorpe, played by Rob Morgan, says, “Madam President, this comet is what we call a planet killer.” This statement completed the effort of the three experts and stopped everyone in their tracks. Unfortunately, it came a bit too late.
The presenters had already lost credibility with the room.
The audience had their own agenda to manage. They had already moved to their preferred key messages and redirected the analysis to their own team. Not as a matter of protocol, but because, “You’re just two people who have walked in here,” despite the high qualifications of the three people who were bringing the issue forward.
The Best Two Lines In the Movie Convey Best Practice
Obviously, I love this particular clip for the wonderful case study it is in data storytelling. But the best lines � the ones that really illustrate what a powerful data story looks like � come 10 minutes later. Two sentences, beautifully delivered by Jennifer Lawrence as Kate Dibiasky, are a pitch-perfect demonstration of what we want to see in a data story: “A comet, bigger than the asteroid that destroyed the dinosaurs is headed directly at Earth. If it isn’t deflected, the entire planet dies.”
I mean � wow. It’s problem, context, risk and action in a handful of words.
- Problem: comet heading directly to earth
- Context: bigger than the asteroid that destroyed the dinosaurs
- Risk: entire planet dies
- Action: comet deflection
It stopped her partner cold and even caught the attention of a random passerby. That’s a powerful moment.
I would never have expected a satirical movie to give such a powerful example of data stories at work, but it delivers both a cautionary tale of data stories gone wrong and best practices to help them go right. If you haven’t seen the flick, fire up Netflix ASAP. And if you have watched it, schedule another viewing and let me know what you think through this lens.
Wondering how your team stacks up when it comes to their data storytelling skills? Give me a call and let’s assess.